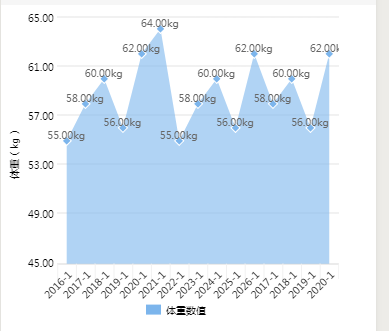
前面看了几个插件应用的效果,这里还是专门看看折线图
官网地址:https://developers.weixin.qq.com/miniprogram/dev/component/canvas.html
拆分了一下,然后需要的就是下面的东西,结果示意图:
test.wxml
<canvas canvas-id="areaCanvas" disable-scroll="false" class="canvas"></canvas>test.wxss
.canvas {
    width: 750rpx;
    height: 500rpx;
    margin: 0 auto;
    background: #fff;
}
test.js
// miniprogram/pages/test/test.js
var wxCharts = require('../../utils/wxcharts.js'); // 引入wx-charts.js文件

Page({

  /**
   * 页面的初始数据
   */
  data: {

  },

  /**
   * 生命周期函数--监听页面加载
   */
  onLoad: function (options) {
    // 屏幕宽度
    this.setData({
      windowWidth: wx.getSystemInfoSync().windowWidth / 750 * 700 ,
      windowHeight: wx.getSystemInfoSync().windowHeight / 750 * 300
    });
  },

  /**
   * 生命周期函数--监听页面显示
   */
  onShow: function () {

    //areaCanvas 15个数据
    new wxCharts({
      canvasId: 'areaCanvas',
      type: 'area',
      categories: ['2016-1', '2017-1', '2018-1', '2019-1', '2020-1', '2021-1', '2022-1', '2023-1', '2024-1', '2025-1', '2026-1', '2017-1', '2018-1', '2019-1', '2020-1'],
      animation: true,
      series: [{
        name: '体重数值',
        data: [55, 58, 60, 56, 62, 64, 55, 58, 60, 56, 62, 58, 60, 56, 62],
        format: function (val) {
          return val.toFixed(2) + 'kg';
        }
      }],
      yAxis: {
        title: '体重(kg)',
        format: function (val) {
          return val.toFixed(2);
        },
        min: 45,
        fontColor: '#000',
        gridColor: '#E5E5E5',
        titleFontColor: '#000'
      },
      xAxis: {
        fontColor: '#000',
        gridColor: '#F1F1F1'
      },
      extra: {
        legendTextColor: '#000'
      },
      width: this.data.windowWidth,
      height: this.data.windowHeight
    });

  }
})


