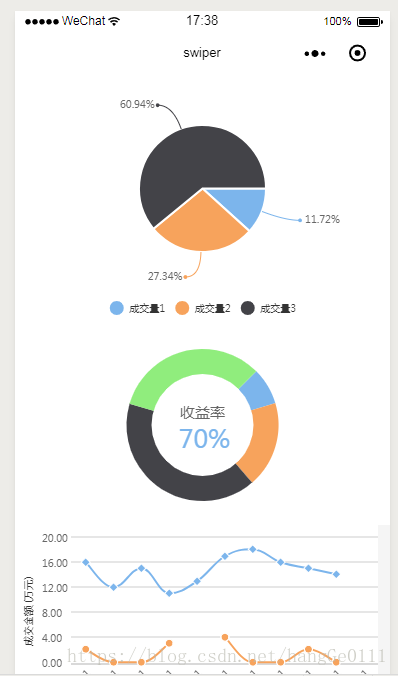
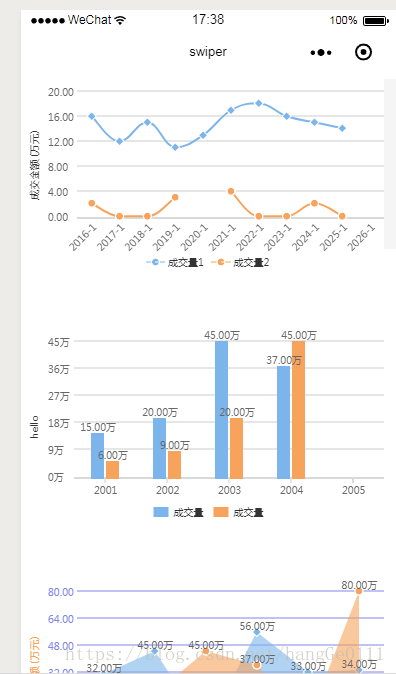
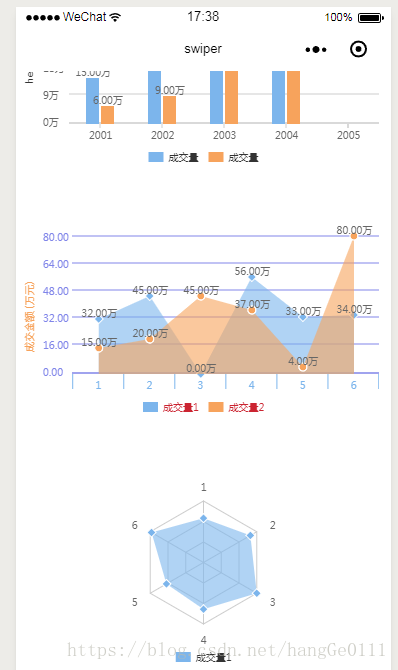
简单了解一下绘制折线图
官网地址:https://developers.weixin.qq.com/miniprogram/dev/component/canvas.html
在学习之前,不妨来使用一些别人封装好的图表组件,看看效果。使用教程:https://blog.csdn.net/hangGe0111/article/details/81633947
- 得到wxcharts.js
我放置在了我的站点目录,地址:地址
下载下来,然后我放置在了utils文件夹下 - 按照教程测试
test.wxml
<canvas canvas-id="pieCanvas" disable-scroll="true" class="canvas"></canvas>
<canvas canvas-id="ringCanvas" disable-scroll="true" class="canvas canvas2"></canvas>
<canvas canvas-id="lineCanvas" disable-scroll="true" class="canvas"></canvas>
<canvas canvas-id="columnCanvas" disable-scroll="true" class="canvas"></canvas>
<canvas canvas-id="areaCanvas" disable-scroll="true" class="canvas"></canvas>
<canvas canvas-id="radarCanvas" disable-scroll="true" class="canvas canvas2"></canvas>
test.wxss
.canvas {
    width: 750rpx;
    height: 500rpx;
}
.canvas2{
  height: 400rpx;
}
test.js
// miniprogram/pages/test/test.js
var wxCharts = require('../../utils/wxcharts.js'); // 引入wx-charts.js文件
// pages/wxcharts/wxcharts.js
//定义记录初始屏幕宽度比例,便于初始化
var windowW = 0;

Page({

  /**
   * 页面的初始数据
   */
  data: {

  },

  /**
   * 生命周期函数--监听页面加载
   */
  onLoad: function (options) {

    // 屏幕宽度
    this.setData({
      imageWidth: wx.getSystemInfoSync().windowWidth
    });
    console.log(this.data.imageWidth);

    //计算屏幕宽度比列
    windowW = this.data.imageWidth / 375;
    console.log(windowW);

  },

  /**
   * 生命周期函数--监听页面显示
   */
  onShow: function () {

    // pieCanvas
    new wxCharts({
      animation: true, //是否有动画
      canvasId: 'pieCanvas',
      type: 'pie',
      series: [{
        name: '成交量1',
        data: 15,
      }, {
        name: '成交量2',
        data: 35,
      }, {
        name: '成交量3',
        data: 78,
      }],
      width: (375 * windowW),
      height: (250 * windowW),
      dataLabel: true,
    });

    // ringCanvas
    new wxCharts({
      animation: true,
      canvasId: 'ringCanvas',
      type: 'ring',
      extra: {
        ringWidth: 25,
        pie: {
          offsetAngle: -45
        }
      },
      title: {
        name: '70%',
        color: '#7cb5ec',
        fontSize: 25
      },
      subtitle: {
        name: '收益率',
        color: '#666666',
        fontSize: 15
      },
      series: [{
        name: '成交量1',
        data: 15,
        stroke: false
      }, {
        name: '成交量2',
        data: 35,
        stroke: false
      }, {
        name: '成交量3',
        data: 78,
        stroke: false
      }, {
        name: '成交量4',
        data: 63,
        stroke: false
      }],
      disablePieStroke: true,
      width: (375 * windowW),
      height: (200 * windowW),
      dataLabel: false,
      legend: false,
      padding: 0
    });

    //lineCanvas
    new wxCharts({
      canvasId: 'lineCanvas',
      type: 'line',
      categories: ['2016-1', '2017-1', '2018-1', '2019-1', '2020-1', '2021-1', '2022-1', '2023-1', '2024-1', '2025-1', '2026-1'],
      animation: true,
      background: '#f5f5f5',
      series: [{
        name: '成交量1',
        data: [16, 12, 15, 11, 13, 17, 18, 16, 15, 14],
        format: function (val, name) {
          return val.toFixed(2) + '万';
        }
      }, {
        name: '成交量2',
        data: [2, 0, 0, 3, null, 4, 0, 0, 2, 0],
        format: function (val, name) {
          return val.toFixed(2) + '万';
        }
      }],
      xAxis: {
        disableGrid: true
      },
      yAxis: {
        title: '成交金额 (万元)',
        format: function (val) {
          return val.toFixed(2);
        },
        min: 0
      },
      width: (375 * windowW),
      height: (200 * windowW),
      dataLabel: false,
      dataPointShape: true,
      extra: {
        lineStyle: 'curve'
      }
    });

    //columnCanvas
    new wxCharts({
      canvasId: 'columnCanvas',
      type: 'column',
      animation: true,
      categories: [2001, 2002, 2003, 2004, 2005],
      series: [{
        name: '成交量',
        data: [15.00, 20.00, 45.00, 37.00],
        format: function (val, name) {
          return val.toFixed(2) + '万';
        }
      }, {
        name: '成交量',
        data: [6.00, 9.00, 20.00, 45.00],
        format: function (val, name) {
          return val.toFixed(2) + '万';
        }
      }],
      yAxis: {
        format: function (val) {
          return val + '万';
        },
        title: 'hello',
        min: 0
      },
      xAxis: {
        disableGrid: false,
        type: 'calibration'
      },
      extra: {
        column: {
          width: 15
        }
      },
      width: (375 * windowW),
      height: (200 * windowW),
    });

    //areaCanvas
    new wxCharts({
      canvasId: 'areaCanvas',
      type: 'area',
      categories: ['1', '2', '3', '4', '5', '6'],
      animation: true,
      series: [{
        name: '成交量1',
        data: [32, 45, 0, 56, 33, 34],
        format: function (val) {
          return val.toFixed(2) + '万';
        }
      }, {
        name: '成交量2',
        data: [15, 20, 45, 37, 4, 80],
        format: function (val) {
          return val.toFixed(2) + '万';
        },
      }],
      yAxis: {
        title: '成交金额 (万元)',
        format: function (val) {
          return val.toFixed(2);
        },
        min: 0,
        fontColor: '#8085e9',
        gridColor: '#8085e9',
        titleFontColor: '#f7a35c'
      },
      xAxis: {
        fontColor: '#7cb5ec',
        gridColor: '#7cb5ec'
      },
      extra: {
        legendTextColor: '#cb2431'
      },
      width: (375 * windowW),
      height: (200 * windowW),
    });

    //radarCanvas
    new wxCharts({
      canvasId: 'radarCanvas',
      type: 'radar',
      categories: ['1', '2', '3', '4', '5', '6'],
      series: [{
        name: '成交量1',
        data: [90, 110, 125, 95, 87, 122]
      }],
      width: (375 * windowW),
      height: (200 * windowW),
      extra: {
        radar: {
          max: 50
        }
      }
    });

  },
})
效果图:


